
It’s not been long since we wrote a What’s Up Quanta (announcing that we now have an integration with Blackfire) but considering that we love bringing to life new features, we thought that it was high time to talk a little bit about our recent front-end monitoring feature. 😉
Why monitor an e-commerce website?
For those of you that, like us, are passionate about web performance and e-commerce, you should have seen lately that everybody is talking about the users’ cry for instantness.
E-customers don’t want to wait. If they can’t buy online in a timely manner, and on a website which offer great UX, they will simply leave.
You’ll thus have lost both a chance to sell, and a chance to establish your reputation. And we all know how much money it cost to attract new customer, instead of simply retaining your current ones…
That being said, if you want to reduce your loading times, increase your conversion, retain your customer, AND offer a great UX, then web performance should be your number 1 priority.
And to optimise your web performance, you need to carefully monitor your website. And not just the back-end (which means everything that is invisible to your users : server, response time, network, …etc.)! You need to keep an eye on your front-end (which means everything that is visible to your users : images, pages, links, tags, …etc.) also, to have a complete pictures of where your e-commerce platform could be optimised.
How does our front-end monitoring feature works?
Until recently, Quanta’s main focus was to offer precise, clear and constant back-end monitoring. It means that thanks to our app’s profilers and dashboards, you were able to monitor your back-end and keep track of any incident or slowdown that your server, network, databases, …etc. experienced.
With the front-end monitoring feature, you have the opportunity to analyse more thoroughly the web performance of each page of your e-commerce funnel.
Quanta’s probes now analyse the loading times of the front-end elements (images, CSS, JS, external tags, …etc.) on each of your pages.
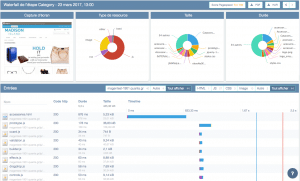
Our waterfall view
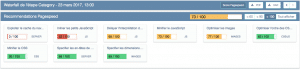
Our waterfall view allows you to track down each resource loaded. As such, you know what happened, for how long, and when! Also, to help you identify the most important issues, we provide you with Google Pagespeed recommendations.
Waterfall of the category page
In other words, you can now discover which of your super heavy kitten image, or which JS line written by your freshly arrived intern, is jeopardizing your web performance and thus your revenue, AND take action right away to correct it.
Pretty neat, ha?
Results?
Some of our clients already tried it, and had mind-boggling results. Seriously.

The first place actually goes to Madura, who reduced its frontend page loading times by 20%, in just one week!
But we’ll soon do a Case Study on this subject, so stay tuned to read about the real life applications of this new feature.